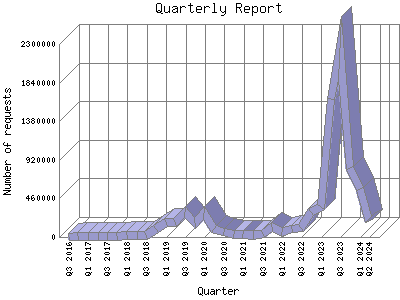
The Quarterly Report shows total activity on your site for each quarter of a
year. Remember that each page hit can result in several server requests as the
images for each page are loaded.
Note: Most likely, the first and
last quarters will not represent a complete quarter's worth of data, resulting
in lower hits.
| Quarter | Number of requests | Percentage of the requests | |
|---|---|---|---|
| 1. | Q2 2026 | 184,493 | 1.53% |
| 2. | Q1 2026 | 263,181 | 2.19% |
| 3. | Q4 2025 | 241,031 | 1.100% |
| 4. | Q3 2025 | 366,557 | 3.4% |
| 5. | Q2 2025 | 515,551 | 4.28% |
| 6. | Q1 2025 | 724,547 | 6% |
| 7. | Q4 2024 | 414,109 | 3.43% |
| 8. | Q3 2024 | 563,144 | 4.68% |
| 9. | Q2 2024 | 823,118 | 6.82% |
| 10. | Q1 2024 | 572,819 | 4.76% |
| 11. | Q4 2023 | 821,159 | 6.81% |
| 12. | Q3 2023 | 2,254,057 | 18.70% |
| 13. | Q2 2023 | 1,643,054 | 13.62% |
| 14. | Q1 2023 | 354,674 | 2.94% |
| 15. | Q4 2022 | 302,596 | 2.51% |
| 16. | Q3 2022 | 105,959 | 0.88% |
| 17. | Q2 2022 | 93,131 | 0.78% |
| 18. | Q1 2022 | 60,430 | 0.50% |
| 19. | Q4 2021 | 117,490 | 0.98% |
| 20. | Q3 2021 | 37,761 | 0.31% |
| 21. | Q2 2021 | 26,976 | 0.22% |
| 22. | Q1 2021 | 32,616 | 0.28% |
| 23. | Q4 2020 | 37,949 | 0.31% |
| 24. | Q3 2020 | 55,322 | 0.46% |
| 25. | Q2 2020 | 101,004 | 0.83% |
| 26. | Q1 2020 | 289,348 | 2.40% |
| 27. | Q4 2019 | 172,753 | 1.43% |
| 28. | Q3 2019 | 302,852 | 2.51% |
| 29. | Q2 2019 | 183,170 | 1.51% |
| 30. | Q1 2019 | 174,956 | 1.46% |
| 31. | Q4 2018 | 89,736 | 0.74% |
| 32. | Q3 2018 | 22,403 | 0.19% |
| 33. | Q2 2018 | 21,113 | 0.18% |
| 34. | Q1 2018 | 19,572 | 0.17% |
| 35. | Q4 2017 | 14,988 | 0.12% |
| 36. | Q3 2017 | 15,935 | 0.13% |
| 37. | Q2 2017 | 12,728 | 0.10% |
| 38. | Q1 2017 | 8,306 | 0.7% |
| 39. | Q4 2016 | 11,952 | 0.10% |
| 40. | Q3 2016 | 4,570 | 0.3% |
Most active quarter Q3 2023 : 2,254,057 requests handled.
Quarterly average: 301427 requests handled.
This report was generated on June 14, 2026 02:38.
Report time frame September 4, 2016 00:15 to June 13, 2026 04:59.
| Web statistics report produced by: | |
 Analog 5.24 Analog 5.24 |  Report Magic for Analog 2.13 Report Magic for Analog 2.13 |