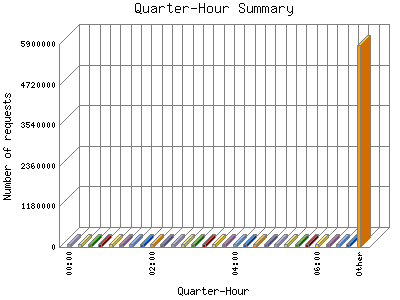
The Quarter-Hour Summary shows an overview of site activity over the course of a day, broken down into fifteen-minute intervals. If your report has enough traffic this will give you a detailed graph of your site's load throughout the day.
| Quarter-Hour | Number of requests | Percentage of the requests | |
|---|---|---|---|
| 1. | 00:00 | 78,721 | 0.98% |
| 2. | 00:15 | 92,382 | 1.14% |
| 3. | 00:30 | 81,316 | 1.1% |
| 4. | 00:45 | 82,029 | 1.2% |
| 5. | 01:00 | 79,643 | 0.100% |
| 6. | 01:15 | 80,519 | 1% |
| 7. | 01:30 | 80,962 | 1% |
| 8. | 01:45 | 79,118 | 0.99% |
| 9. | 02:00 | 87,091 | 1.9% |
| 10. | 02:15 | 79,629 | 0.100% |
| 11. | 02:30 | 78,241 | 0.98% |
| 12. | 02:45 | 77,339 | 0.97% |
| 13. | 03:00 | 77,462 | 0.97% |
| 14. | 03:15 | 78,751 | 0.99% |
| 15. | 03:30 | 76,745 | 0.96% |
| 16. | 03:45 | 80,483 | 1% |
| 17. | 04:00 | 79,550 | 0.100% |
| 18. | 04:15 | 78,904 | 0.99% |
| 19. | 04:30 | 79,407 | 0.99% |
| 20. | 04:45 | 79,337 | 0.99% |
| 21. | 05:00 | 77,951 | 0.98% |
| 22. | 05:15 | 81,665 | 1.1% |
| 23. | 05:30 | 78,383 | 0.98% |
| 24. | 05:45 | 78,274 | 0.98% |
| 25. | 06:00 | 77,595 | 0.97% |
| 26. | 06:15 | 75,338 | 0.93% |
| 27. | 06:30 | 77,577 | 0.97% |
| 28. | 06:45 | 93,212 | 1.16% |
| 29. | 07:00 | 78,438 | 0.98% |
| 30. | 07:15 | 78,860 | 0.99% |
| 31. | 07:30 | 79,475 | 0.99% |
| 32. | 07:45 | 79,196 | 0.99% |
| 33. | 08:00 | 78,634 | 0.98% |
| 34. | 08:15 | 77,965 | 0.98% |
| 35. | 08:30 | 77,899 | 0.97% |
| 36. | 08:45 | 80,807 | 1% |
| 37. | 09:00 | 80,736 | 1% |
| 38. | 09:15 | 79,256 | 0.99% |
| 39. | 09:30 | 78,284 | 0.98% |
| 40. | 09:45 | 79,099 | 0.99% |
| 41. | 10:00 | 78,651 | 0.98% |
| 42. | 10:15 | 80,801 | 1% |
| 43. | 10:30 | 79,659 | 0.100% |
| 44. | 10:45 | 79,877 | 0.100% |
| 45. | 11:00 | 80,804 | 1% |
| 46. | 11:15 | 81,249 | 1.1% |
| 47. | 11:30 | 81,540 | 1.1% |
| 48. | 11:45 | 85,700 | 1.7% |
| 49. | 12:00 | 82,545 | 1.2% |
| 50. | 12:15 | 80,607 | 1% |
| 51. | 12:30 | 84,210 | 1.4% |
| 52. | 12:45 | 85,019 | 1.6% |
| 53. | 13:00 | 85,516 | 1.7% |
| 54. | 13:15 | 90,259 | 1.12% |
| 55. | 13:30 | 83,256 | 1.3% |
| 56. | 13:45 | 88,383 | 1.10% |
| 57. | 14:00 | 89,186 | 1.10% |
| 58. | 14:15 | 86,690 | 1.8% |
| 59. | 14:30 | 90,796 | 1.12% |
| 60. | 14:45 | 87,663 | 1.10% |
| 61. | 15:00 | 97,146 | 1.20% |
| 62. | 15:15 | 89,640 | 1.11% |
| 63. | 15:30 | 88,423 | 1.10% |
| 64. | 15:45 | 91,816 | 1.14% |
| 65. | 16:00 | 88,090 | 1.10% |
| 66. | 16:15 | 87,384 | 1.9% |
| 67. | 16:30 | 86,097 | 1.8% |
| 68. | 16:45 | 88,078 | 1.10% |
| 69. | 17:00 | 87,521 | 1.9% |
| 70. | 17:15 | 86,561 | 1.8% |
| 71. | 17:30 | 88,452 | 1.10% |
| 72. | 17:45 | 91,840 | 1.14% |
| 73. | 18:00 | 85,809 | 1.7% |
| 74. | 18:15 | 91,980 | 1.14% |
| 75. | 18:30 | 95,164 | 1.19% |
| 76. | 18:45 | 92,298 | 1.14% |
| 77. | 19:00 | 91,506 | 1.13% |
| 78. | 19:15 | 90,789 | 1.12% |
| 79. | 19:30 | 90,787 | 1.12% |
| 80. | 19:45 | 92,802 | 1.16% |
| 81. | 20:00 | 95,429 | 1.19% |
| 82. | 20:15 | 90,691 | 1.12% |
| 83. | 20:30 | 85,022 | 1.6% |
| 84. | 20:45 | 87,534 | 1.9% |
| 85. | 21:00 | 83,010 | 1.3% |
| 86. | 21:15 | 86,512 | 1.8% |
| 87. | 21:30 | 86,436 | 1.8% |
| 88. | 21:45 | 85,630 | 1.7% |
| 89. | 22:00 | 82,126 | 1.2% |
| 90. | 22:15 | 84,718 | 1.6% |
| 91. | 22:30 | 80,663 | 1% |
| 92. | 22:45 | 81,431 | 1.1% |
| 93. | 23:00 | 79,437 | 0.99% |
| 94. | 23:15 | 82,294 | 1.2% |
| 95. | 23:30 | 80,100 | 0.100% |
| 96. | 23:45 | 87,178 | 1.9% |
This report was generated on April 25, 2024 01:58.
Report time frame September 4, 2016 00:15 to April 24, 2024 04:59.
| Web statistics report produced by: | |
 Analog 5.24 Analog 5.24 |  Report Magic for Analog 2.13 Report Magic for Analog 2.13 |